In the first part of this report, published in The Hindu on Saturday (August 16, 2025), we highlighted the substantial limitations on citizen access to documents asked for by the Election Commission (EC). In this second part, we seek answers to two questions: who stands to lose in the special intensive revision (SIR) process, and what it implies in terms of citizen trust in elections and the EC.
On the face of it, and particularly for relatively better-placed citizens, the requirement of documents may appear ‘reasonable’ and easy to fulfil. But on closer scrutiny, it becomes clear that as one moves down the social ladder, this requirement becomes daunting and exclusionary.
Uneven access
Aadhaar cards are nearly universal across all caste groups, but other documents show significant variation (Table 1). PAN card ownership, for example, is highest among the general category respondents, with nine in every 10 respondents having a PAN, but falls to just over half among Scheduled Castes (SC). Passports are rare across social groups, with only about one in every five in the general category, and a mere 5% and 4% among SC and Scheduled Tribes (ST) respondents, respectively, possessing one. Tenth-class and domicile certificates follow a similar pattern, with higher possession among Other Backward Class (OBC) and general groups. Interestingly, caste certificates are far more common among ST respondents, with four of every five possessing one. In Assam, the National Register of Citizens (NRC) documents are almost universally held (95-99%) across all groups.
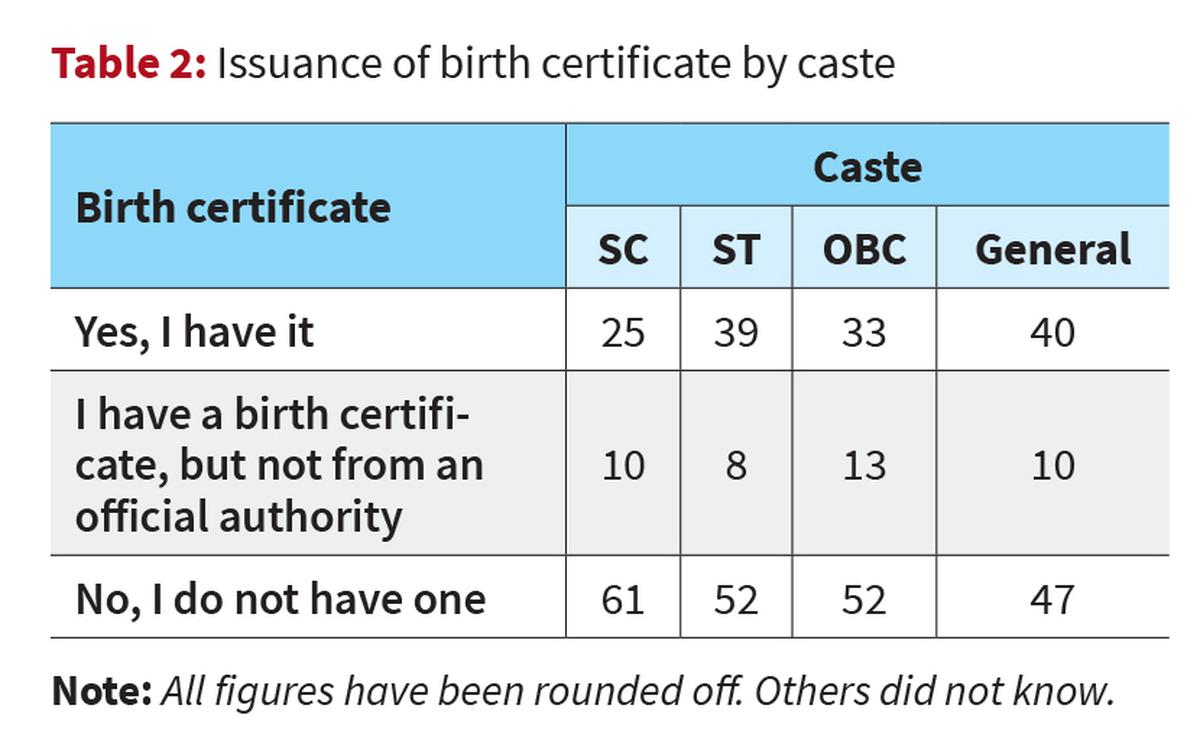
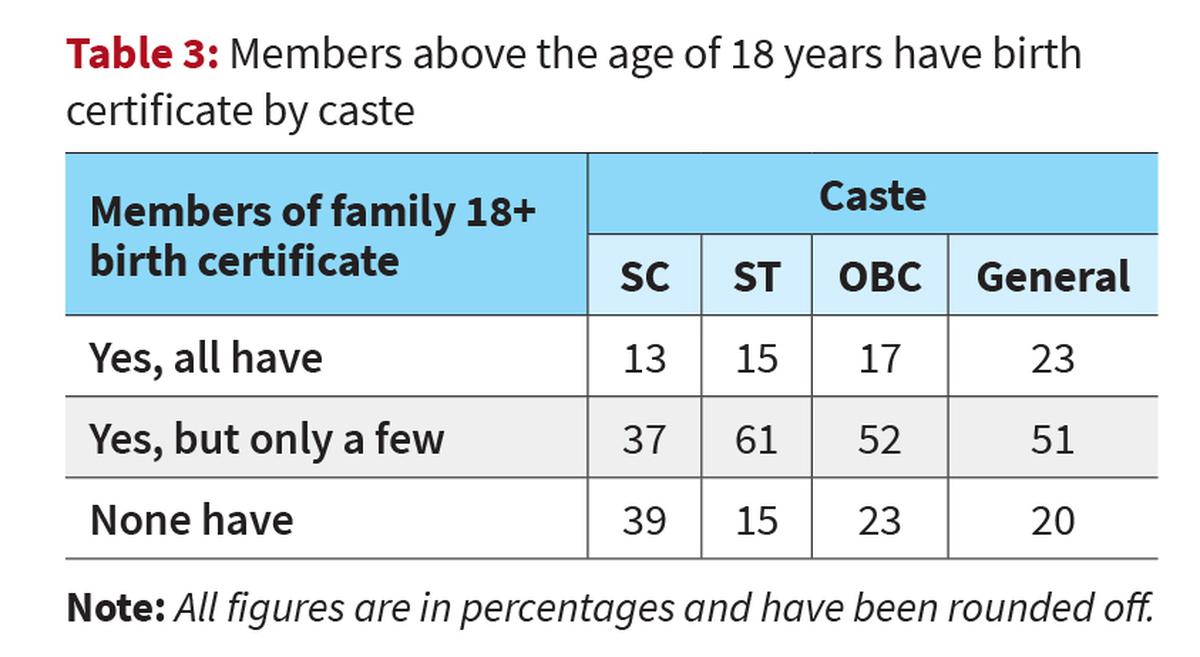
These gaps extend to birth certificate ownership, as shown in Table 2. Less than half of any caste group have one, with SCs showing the lowest coverage (about one in four), while the general category fares better (two in every five). When considering entire households (Table 3), the proportion of families where every adult member has a birth certificate is even smaller — less than one-fourth in the general group, and just more than one in every 10 among SCs.
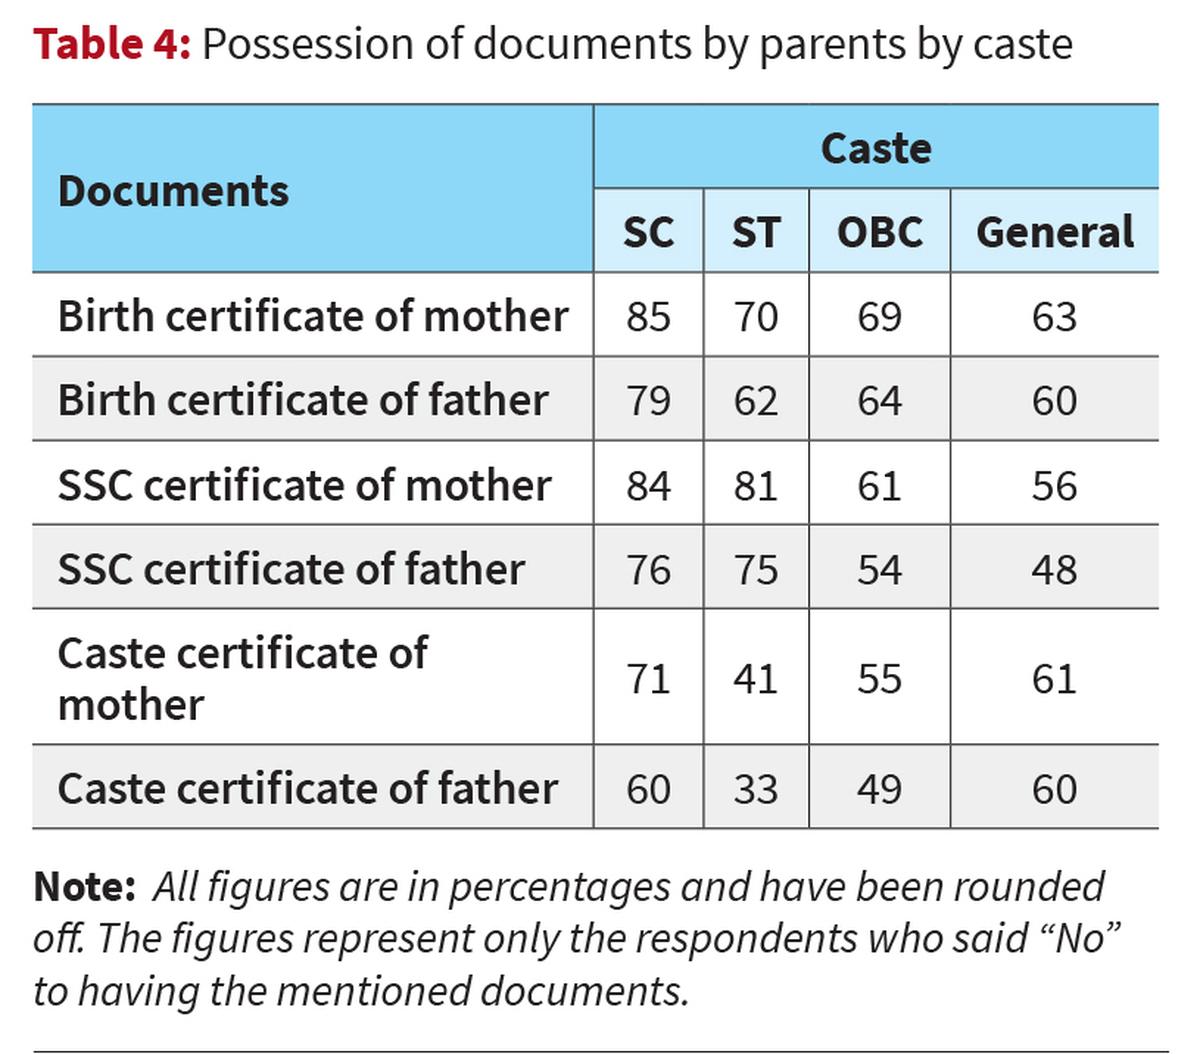
The documentation status of parents tells a similar story of uneven access. Large numbers across all caste groups report that their parents lack key documents such as SSC certificates or birth certificates. Among SC respondents, more than eight in every 10 mothers have no birth certificate, and three in every five fathers lack a caste certificate. While the general category shows slightly better figures, the gap remains substantial (Table 4).
Economic status
Economic status further deepens the divide. Aadhaar coverage is nearly universal across all income groups, but wealthier respondents are far more likely to own PAN cards, passports, and educational certificates. Nearly half of the rich possess passports, compared with just one in 20 among the poor. Domicile and caste certificates also rise sharply with income. It is interesting to see that land/house allotment certificates are owned by nearly half the respondents across economic groups (Table 5).
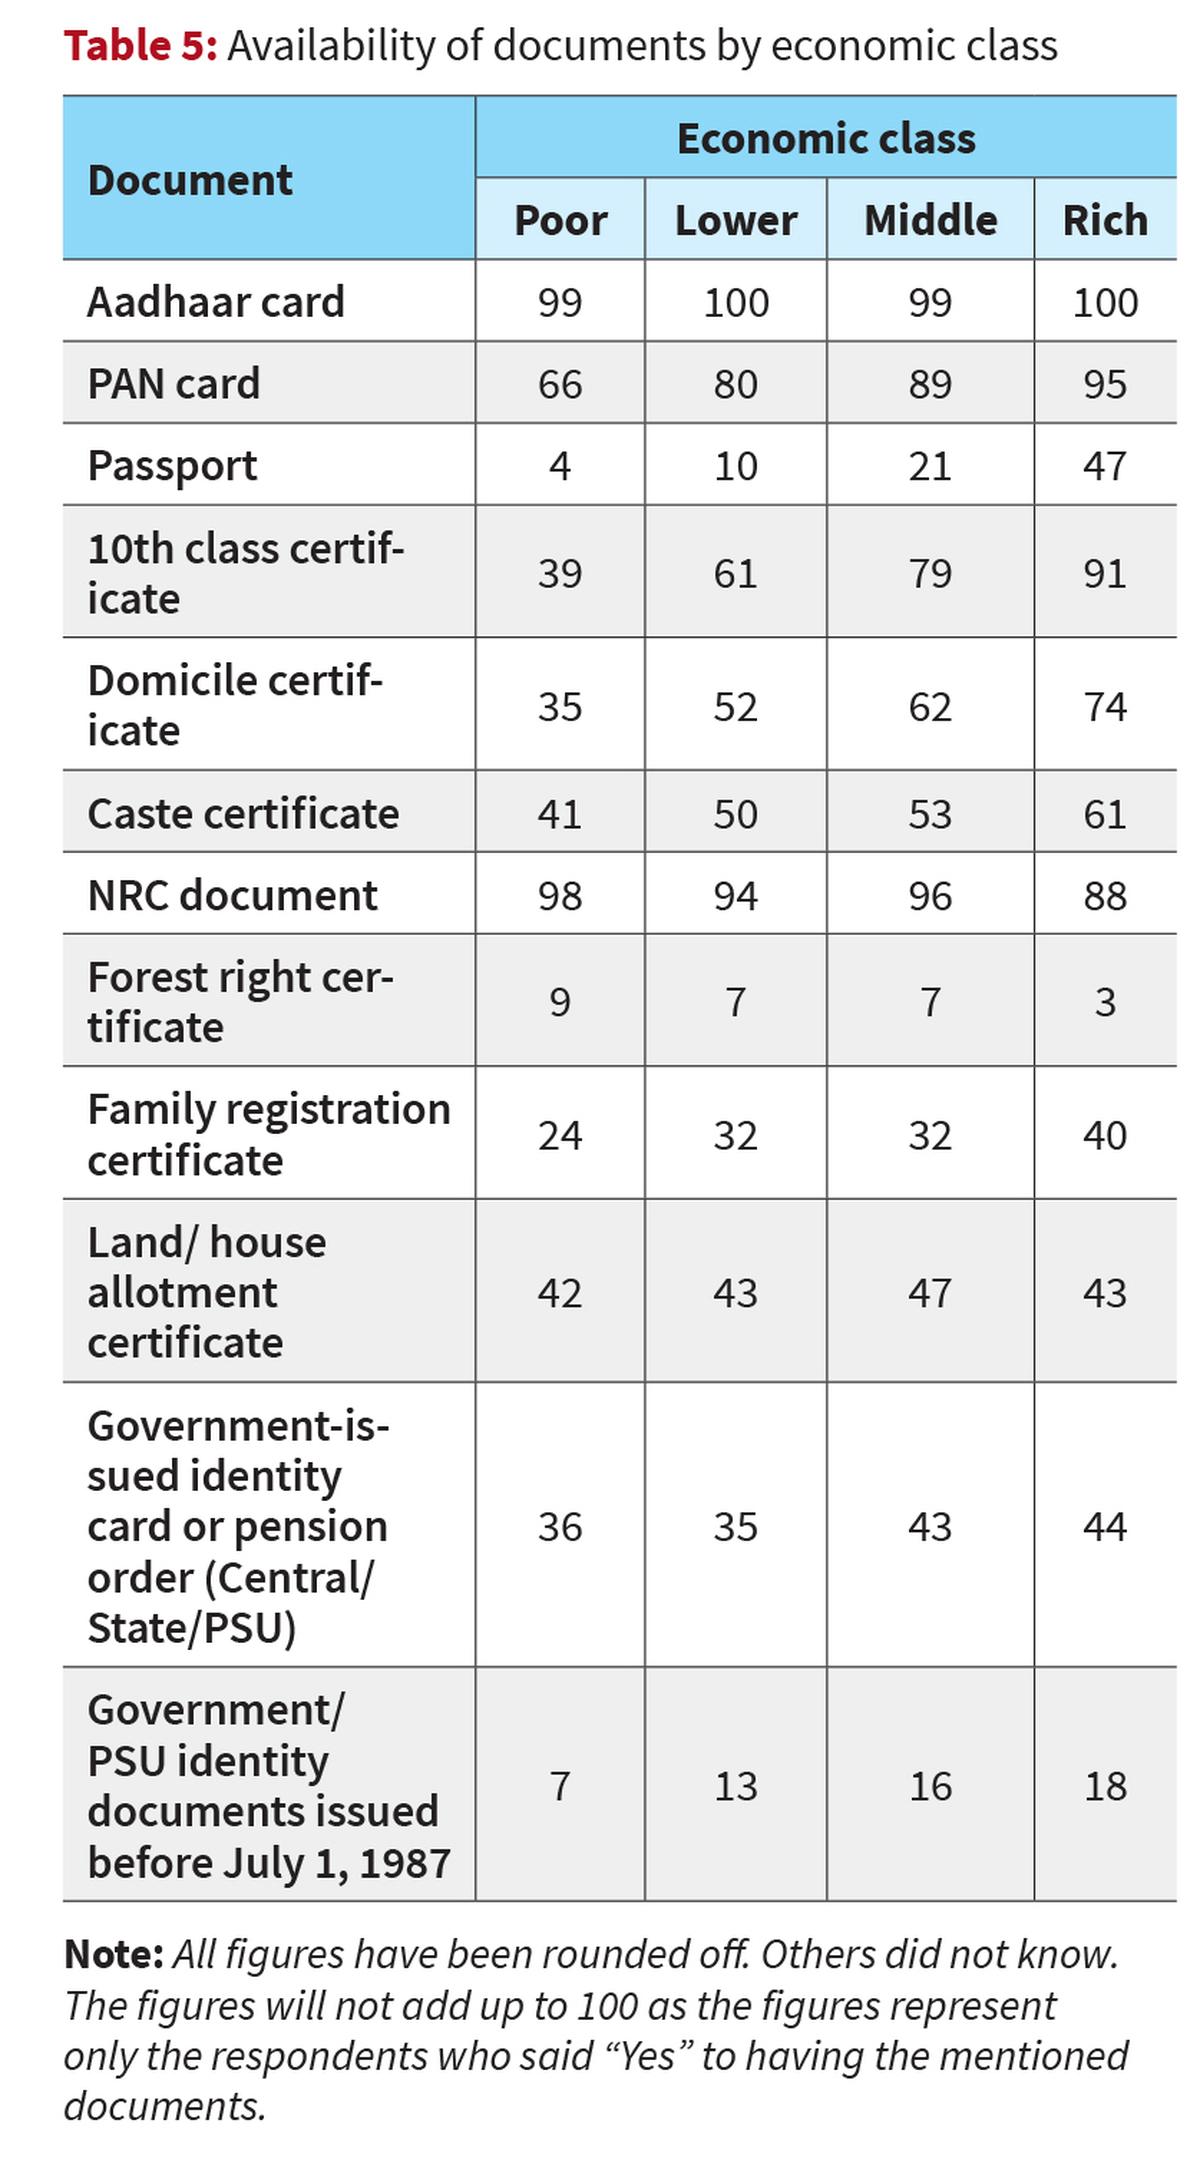
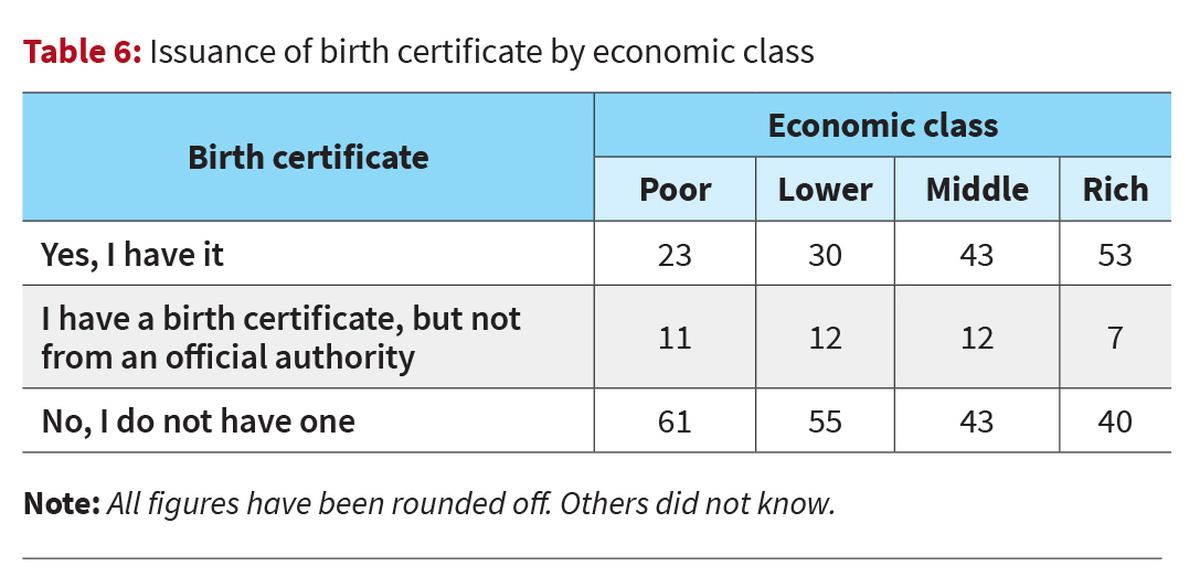
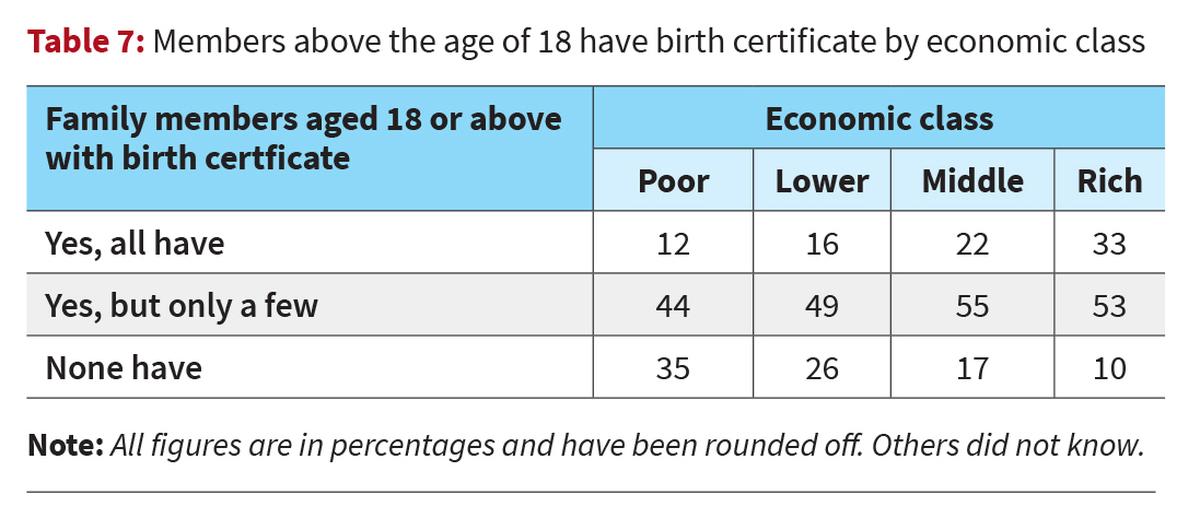
Economic location is similarly a major factor associated with exclusion of citizens in terms of document possession (Table 5). It plays a decisive role in birth certificate possession, both at the individual and household level, as shown in Tables 6 and 7, respectively. Among the poorest respondents, fewer than one in every four have an official birth certificate, and six in every 10 have none at all, while over half of the well-to-do respondents possess a birth certificate. This gap extends to entire families — only about one in every 10 poor households said every adult member had a birth certificate, compared with one in every three among the rich.
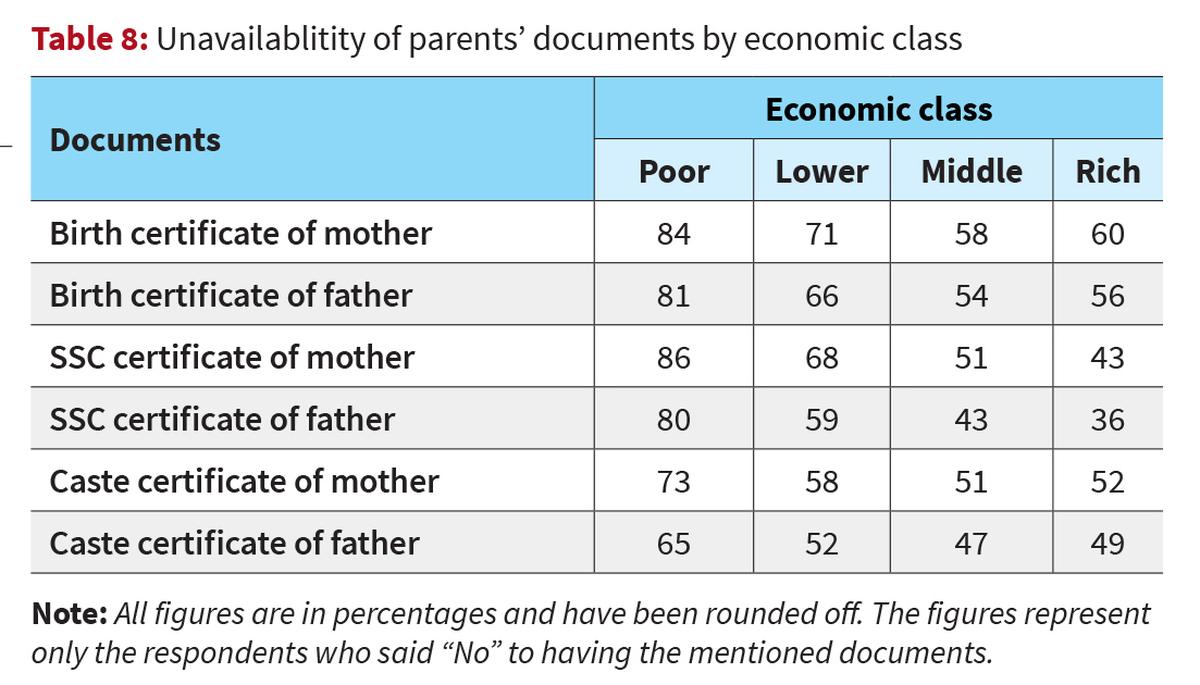
Parental documentation follows the same pattern (Table 8), with poor households far more likely to report that parents lack educational or identity documents. For example, over eight of every 10 poor respondents say their mother has no SSC certificate, compared to just over two of every five in rich households. This may be because older generations in poorer households often had limited access to formal education and fewer opportunities to obtain official identification.
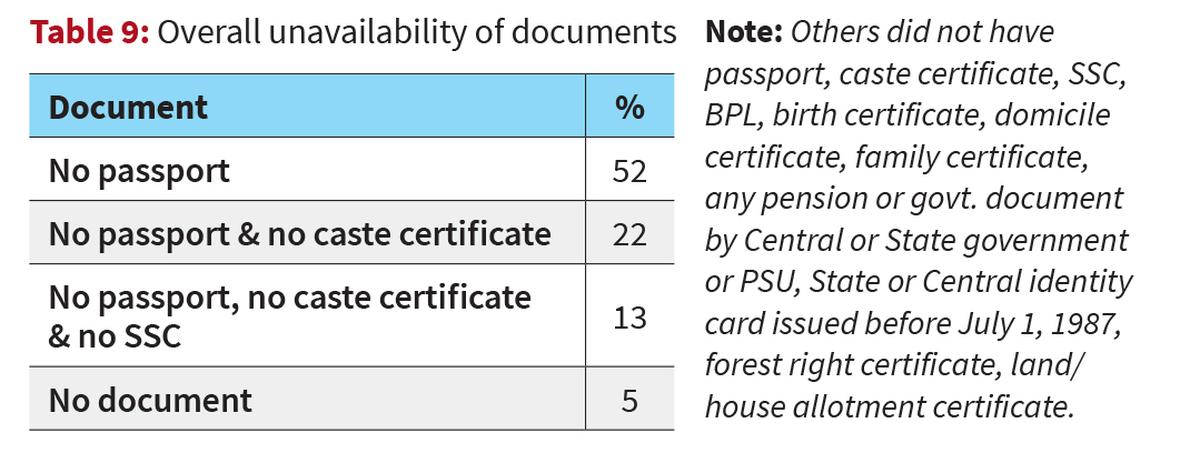
The study further reveals the overall extent of document absence (Table 9). More than half of respondents do not possess a passport, one in five do not possess both a passport and a caste certificate, and 5% have none of the key documents listed.
State-level variations
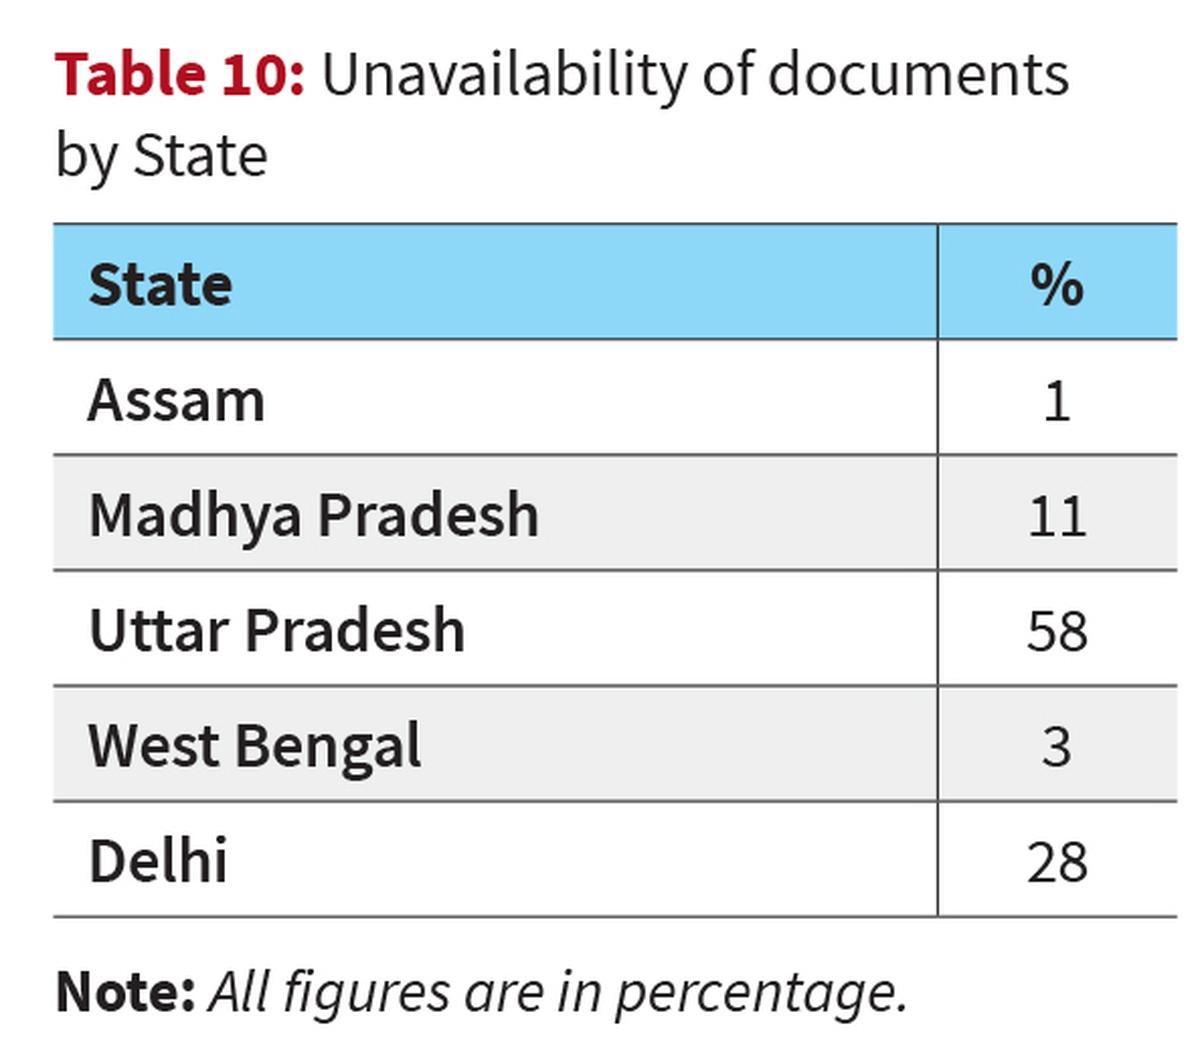
Table 10 reveals striking State-level differences in overall document unavailability. Uttar Pradesh stands out sharply, with nearly three in five respondents lacking the required documents, followed by Delhi, where over a quarter face the same issue.
The significant gaps in document possession, especially birth certificates, across caste and class lines, raise serious concerns about the EC’s decision to make them mandatory for voter verification. Among marginalised castes and poorer households, large sections of the population either never had such documents issued or rely on informal records that may not find acceptance.
Public perception
Even without formal information about the social profile of possible exclusions, respondents are aware of who is going to be excluded. When respondents were asked who might be most affected if birth certificates became mandatory (Table 11), illiterate people and the elderly topped the list, each cited by over two in every five respondents. The poor, rural residents, and migrants were also seen as particularly vulnerable, along with smaller proportions among Muslims, SCs, and STs.
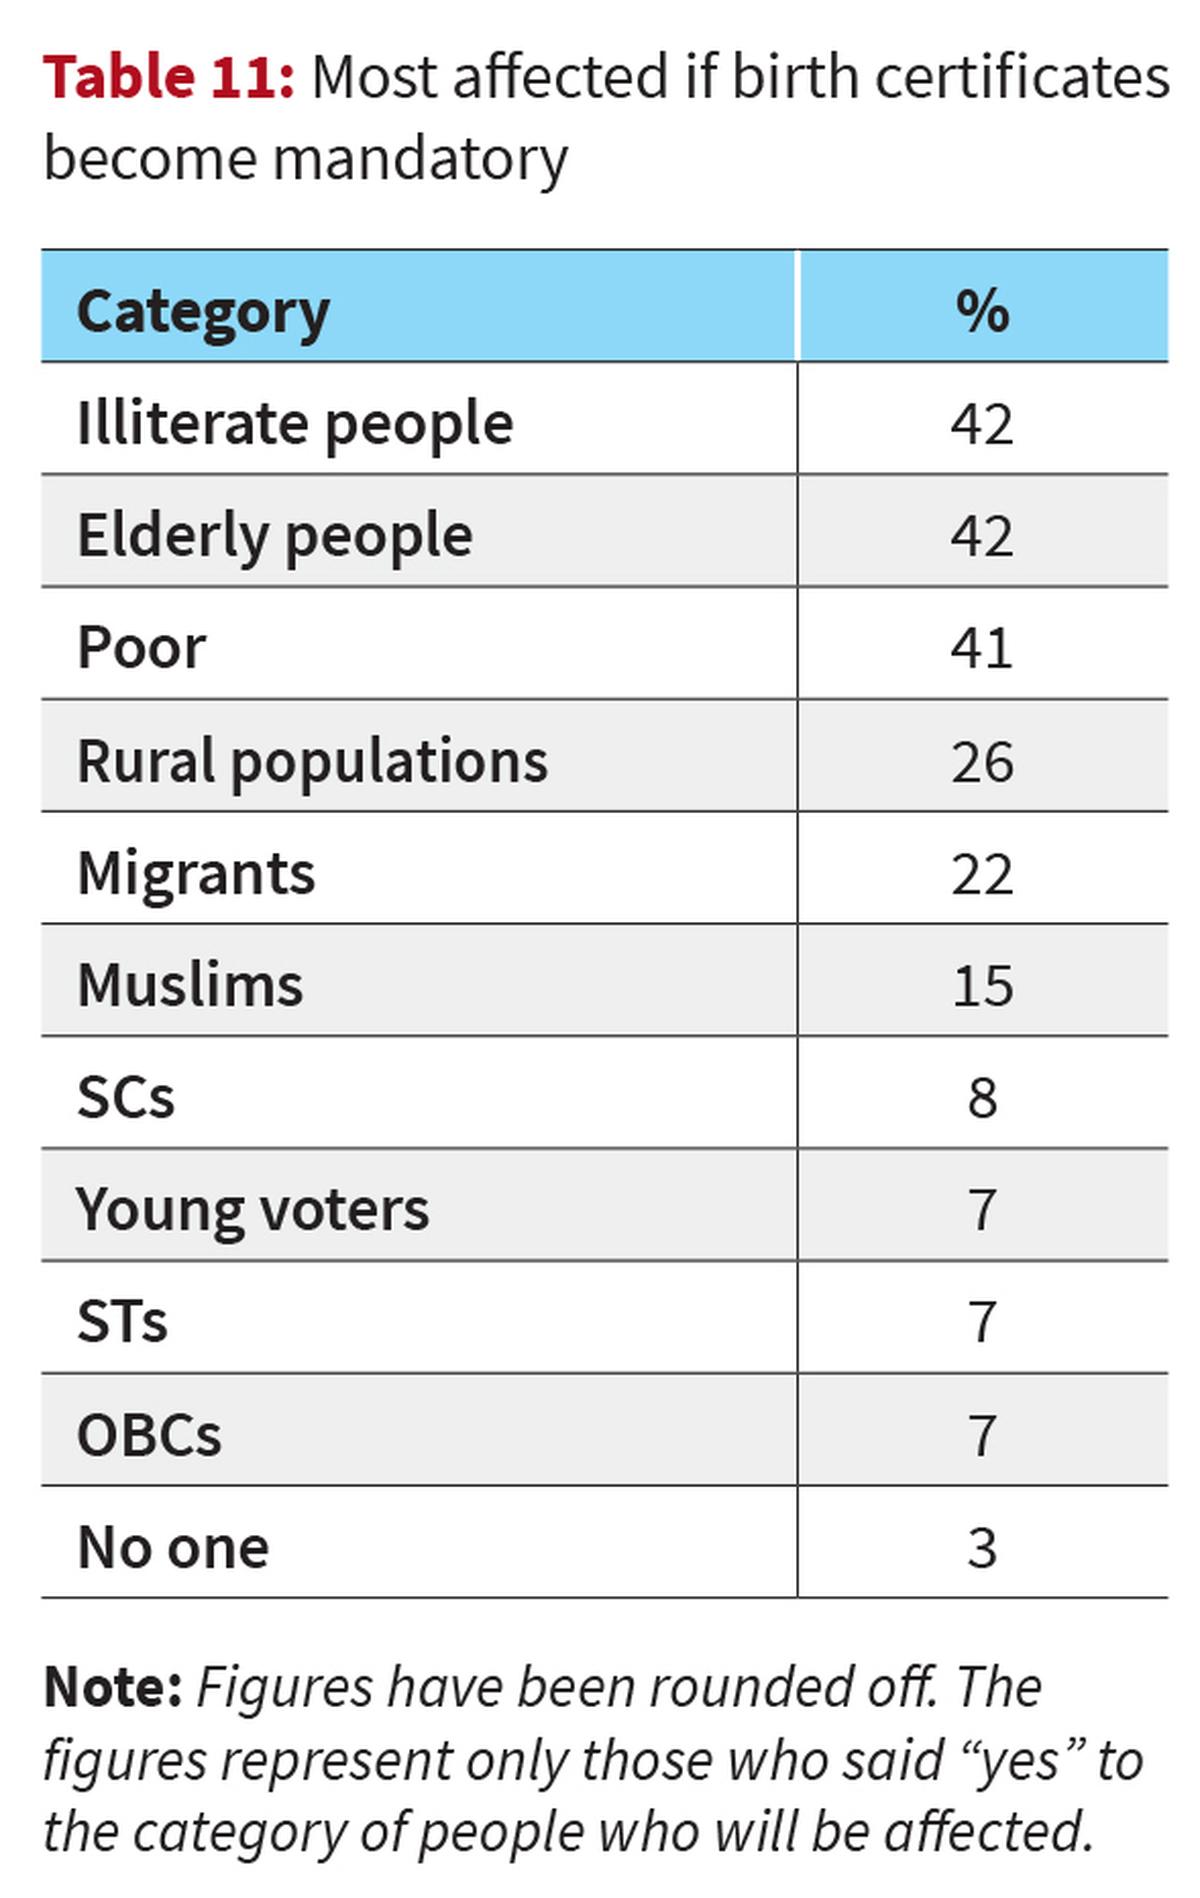
Table 12 indicates that concerns about wrongful exclusion are widespread. Close to half (45%) the respondents believe that genuine voters may be removed from the rolls during the verification process under SIR, while only a quarter think this will not happen. This indicates a significant level of public anxiety that the exercise, if it insists on the documents asked in the Bihar exercise, could disenfranchise eligible citizens.
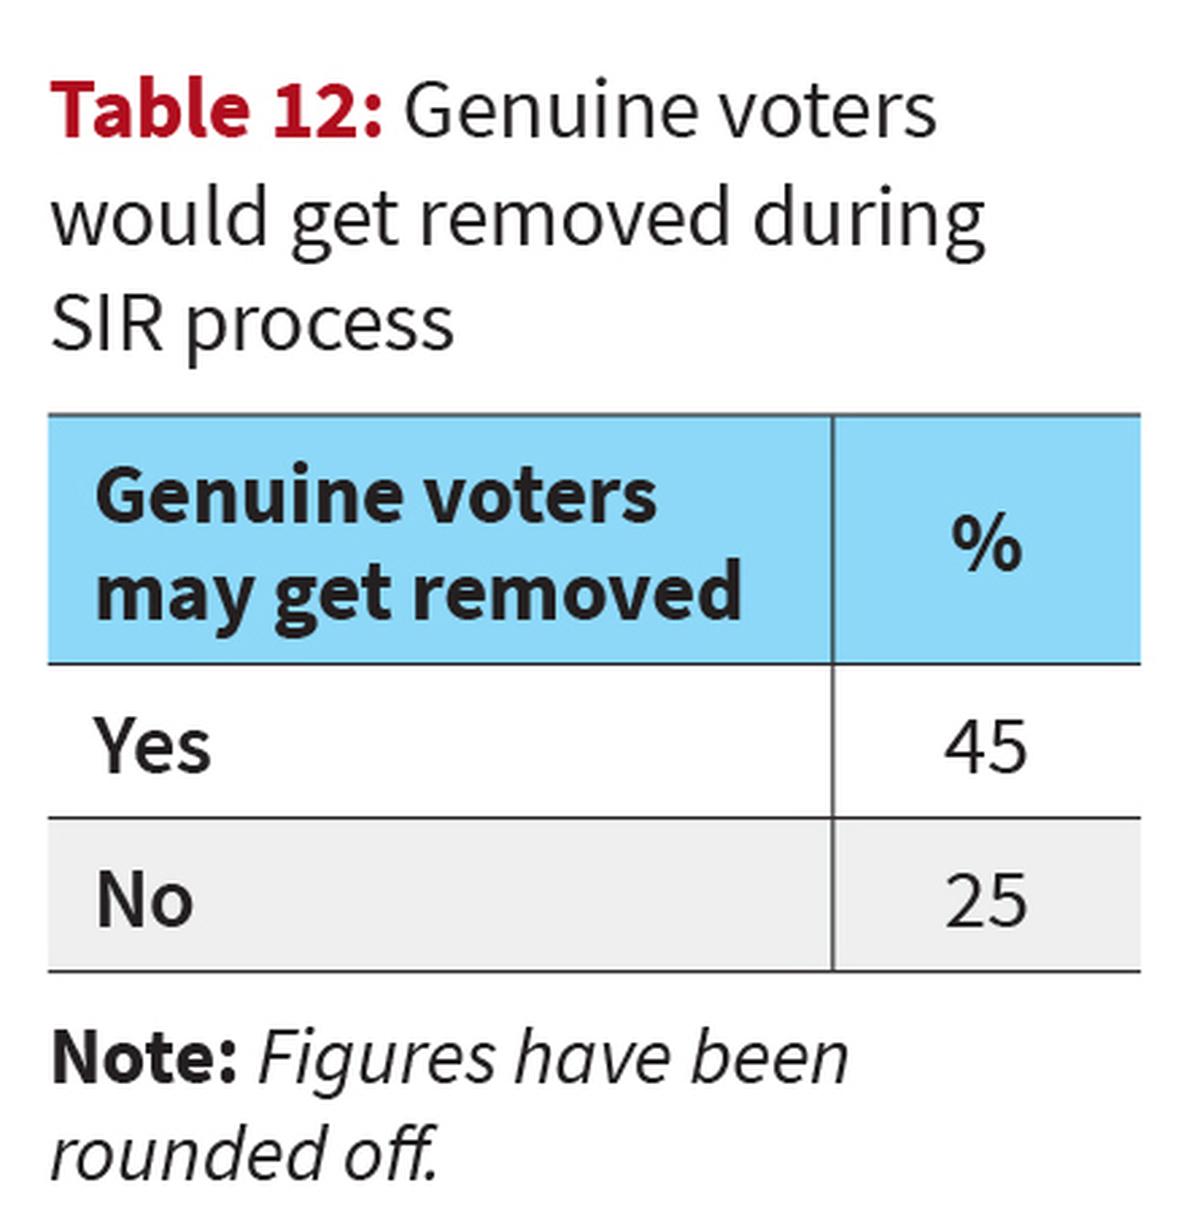
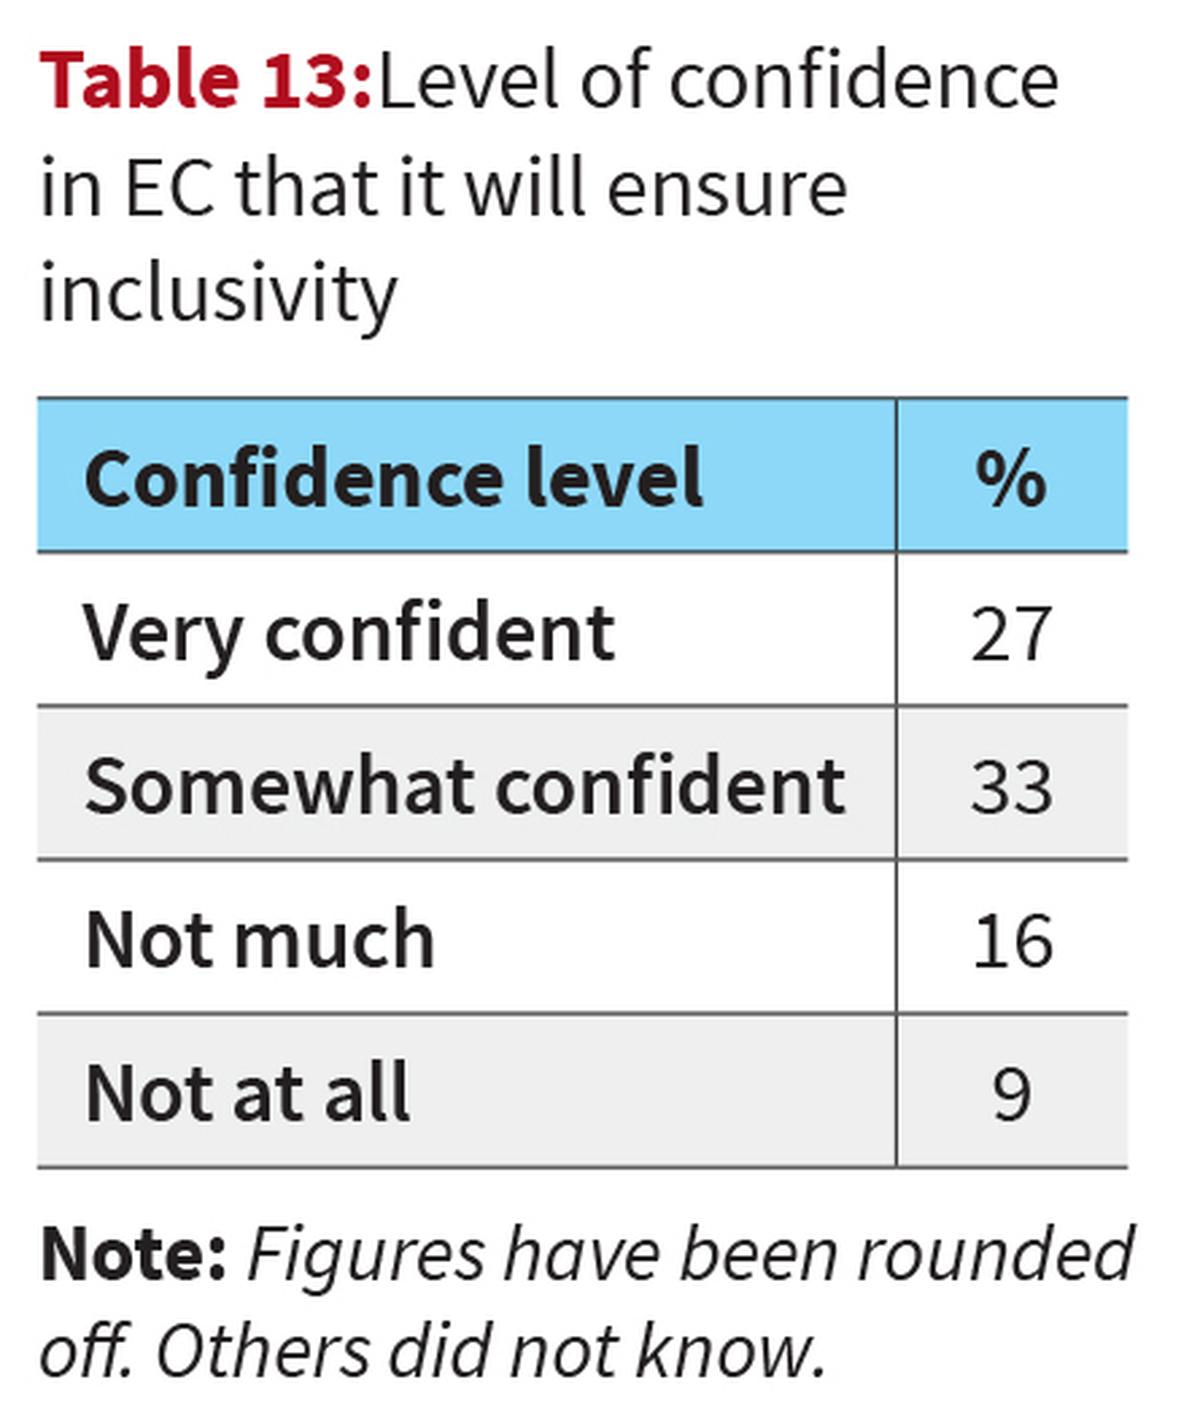
Table 13 indicates that confidence in the EC’s ability to ensure inclusivity is moderate. Just over a quarter of respondents said they were “very confident” that all eligible voters would be retained on the rolls, while one-sixth expressed doubts and said that they had “not much” confidence and nearly one in every 10 had no confidence at all. These figures suggest that while many still trust the EC to manage the process fairly, a sizeable share of the public remains unconvinced.
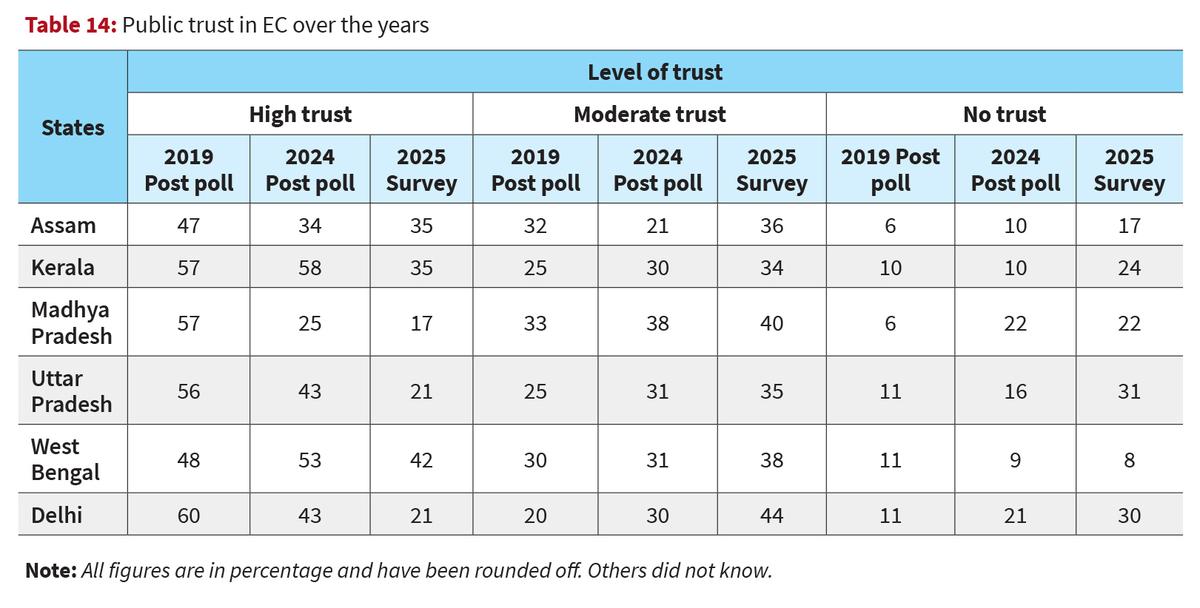
When one analyses the data from the 2019 NES survey, the 2024 NES survey, and the 2025 documentation study, we see a consistent decline in high trust in the EC across all six States and a corresponding increase in the numbers of those who do not trust the EC. In Uttar Pradesh, for instance, the proportion of respondents expressing high trust fell sharply from 56% in 2019 to just 21% in the present study, while “no trust” rose to nearly one-third. Kerala saw a similar trend, with high trust dropping from 57% to 35% over the period, accompanied by increases in moderate and no trust. High trust is replaced by growing numbers who express only moderate trust (Table 14).
The findings from the Lokniti study point out to the challenges associated with the way in which current exercise of voter verification is contemplated. Citizen access to documents is a complex issue.
Verification process puts the onus on citizens for showing the documents but ensuring that citizens will be able to smoothly and routinely access various documents is the responsibility of government. As this analysis has shown, there is a marked social character to non-possession of documents leading to possible exclusion of marginalised sections. As an immediate consequence, EC is likely to take a hit in terms of popular trust and confidence in it. This is a very serious consequence because the high legitimacy of EC is an important part of elections being seen as free and fair.
Moreover, this exclusion is not merely in terms of dropping the names of the poor and the backward from electoral rolls. At a more serious level, and as an unintended consequence of SIR, a stark fact has come to light — the less privileged members of society stand the risk of being pushed to the status of doubtful citizens in every sense. As governments more and more tends to use resources for the benefit of the poor and backward, the possible downgrading of those same sections for non-possession of citizenship documents makes them all the more vulnerable and helpless.
(Suhas Palshikar taught political science and is chief editor of Studies in Indian Politics; Krishangi Sinha is a researcher with Lokniti-CSDS; Sandeep Shastri is vice president (Bangalore), Nitte Education Trust and national coordinator, Lokniti Network; Sanjay Kumar is professor and co-director, Lokniti-CSDS)
Method note for the survey
The study was conducted by Lokniti-CSDS in NCR-Delhi and five States, namely Assam, Kerala, Madhya Pradesh, Uttar Pradesh, and West Bengal.
In each State, five districts were purposively selected, keeping in mind the rural and urban population in each of these five districts. In each of the five districts, four locations were selected keeping in mind the class profile of the people living in these locations, so that the sample has adequate representation of people from lower, middle- and upper-income classes.
At each location, 25 face-to-face interviews were conducted with those respondents who were 18 years or more.
Respondents at sampled locations were selected following a random walk procedure. At the location, field investigators identified a landmark such as school, hospital, or any monument and started to select households from there. They did interviews in such a way that the entire location was covered, leaving a few houses between the sampled households. The method comes very close to simple random selection of the voters for the interview.
Total sample for which data have been analysed is 3,054; roughly 500 interviews in each State. The sample represented people belonging to different social profiles — 44% were women, 48% urban voters, 18% Dalits, 7% Adivasi, 12% Muslims, and 5% Christians (Christians in Kerala sample).